Visual Mode
Live forecast imagery and an interactive winds-aloft map, embedded directly in each section of your briefing — matched to your departure window and cruise altitude.
What Is Visual Mode?
Visual mode is a fourth way to view your PlaneWX briefing, alongside Quick, Enhanced, and Classic. Where other modes present text analysis, Visual mode adds official NOAA/AWC forecast charts — ceilings, turbulence, icing, convective outlook — and an interactive Windy ECMWF winds-aloft map, all embedded inline under the relevant weather section.
Every image is automatically selected to match your flight's departure time and cruise altitude. You see the chart that's most relevant to your window, not just the current-conditions map.
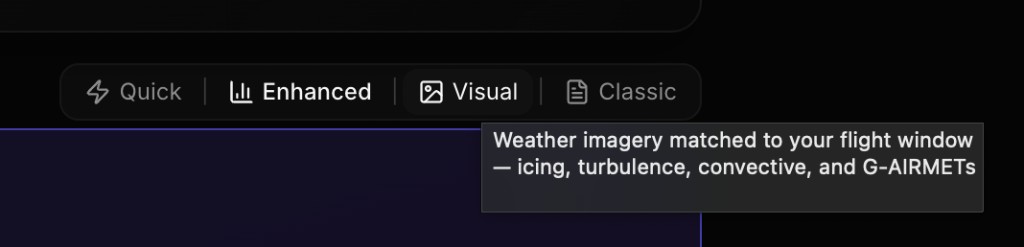
How to activate: Open any briefing and tap Visual in the view toggle bar at the top of the briefing (alongside Quick | Enhanced | Classic). Your preference is saved for future sessions.
The Four Briefing Views
Quick
Compact at-a-glance summary — score, gotchas, and key numbers only. Good for a fast check.
Enhanced
DefaultColor-coded data grids, gauge bars, and source attribution. The full analytical view.
Visual
NewOfficial NOAA/AWC forecast charts and an interactive Windy winds-aloft map, embedded section-by-section. Matched to your departure window and altitude.
Classic
Traditional text-based briefing format — all the same analysis, presented as narrative prose.
What You'll See in Each Section
Visual mode adds imagery to five briefing sections. Multiple charts per section use left/right carousel arrows to flip through them.
The Pattern
- WPC Prog Chart — fronts and surface pressure for the departure window, automatically selected to the WPC forecast hour closest to your flight. For flights departing within 6 hours, this is replaced by the WPC Surface Analysis (current fronts are more accurate than a near-term forecast chart).
- WPC Surface Analysis — always present as the second slide (or the only slide for near-term departures), showing real-time fronts and pressure systems.
Ceilings & Visibility
- AWC Aviation Clouds Forecast (GFA) — the FAA's official Graphical Forecasts for Aviation cloud coverage chart, time-matched to your departure.
- G-AIRMET Sierra — IFR conditions and mountain obscuration advisory, time-stepped to the nearest valid period.
Available within 18 hours of departure. For flights farther out, a horizon notice is shown.
Convective
- SPC Categorical Outlook — the Storm Prediction Center's Day 1, 2, or 3 convective outlook (Marginal / Slight / Enhanced / Moderate / High risk). Auto-selected based on how many days until departure.
Available within 72 hours of departure.
Turbulence
- GTG Total Turbulence — AWC's Graphical Turbulence Guidance "total" product at your cruise altitude (snapped to the nearest available pressure level). Covers clear-air, mountain wave, and convective turbulence.
- G-AIRMET Tango-H / Tango-L — moderate turbulence advisories above and below FL180, time-stepped to your window.
GTG available within 18 hours. G-AIRMET within 12 hours. Horizon notices appear when products aren't yet available for your window.
Icing
- FIP / CIP — Forecast Icing Potential (or Current Icing Product for departures within 1 hour) at your cruise altitude, probability chart. Altitude is snapped to the nearest available analysis level.
Available within 18 hours of departure.
Winds Aloft
InteractiveAn embedded Windy ECMWF interactive map centered on your route, showing wind barbs at your cruise altitude. Altitude selector pills let you step through your cruise level plus the two adjacent pressure levels for comparison.
- • Drag to pan, scroll to zoom
- • Use the altitude pills to compare adjacent levels
- • Use the timeline bar at the bottom of the map to advance to your departure window — the map opens at the current time, not your departure time
AIRMETs & SIGMETs
- G-AIRMET Sierra — IFR conditions and mountain obscuration, time-matched to your departure window.
Available within 12 hours of departure.
Time & Altitude Matching
PlaneWX doesn't just pull the most recent chart — it selects the chart that's most relevant to your specific flight.
Time Matching
Each product has a set of valid forecast hours (e.g., +3h, +6h, +12h). PlaneWX computes the hours from the product's model cycle to your departure and picks the forecast hour closest to your window — so the map you see reflects conditions during your flight, not hours before or after.
Altitude Matching
Icing and turbulence charts are available at discrete pressure levels. PlaneWX snaps your cruise altitude to the nearest available level and shows the chart for that level. The Windy map shows your cruise level plus the two adjacent levels as selectable pills.
Chart label format: Each chart shows a sublabel like Wed 18Z · F30 so you always know exactly when the chart is valid. "F30" means the 30-hour forecast from the WPC cycle that was active when your briefing was generated.
Imagery Freshness Gate
Visual mode shows live imagery fetched directly from NOAA/AWC servers. If you open a briefing that was generated more than 6 hours ago, imagery is automatically hidden and replaced with an amber notice showing when the briefing was last refreshed.
Why 6 hours? NOAA/AWC updates most aviation forecast products every 1–6 hours. A chart generated from a 7-hour-old briefing could reflect a model cycle that has since been superseded — showing conditions that no longer match current forecasts. The freshness gate ensures you only see charts that are consistent with your briefing's analysis.
Fix: Tap the Refresh button on your briefing to generate a fresh briefing — imagery will re-enable immediately.
Forecast Horizon Notices
Most aviation forecast imagery has a limited lookahead window. When your departure is farther out than a product supports, Visual mode shows a small notice in that section rather than displaying an outdated or irrelevant chart.
The Windy winds-aloft map and WPC Surface Analysis are always available regardless of departure time, since they reflect current model data you can step forward manually.
Image Sources
All imagery is fetched directly from the original government or Windy servers — PlaneWX does not modify or re-host any charts. Click any chart to open it on its source website.
Related Help Pages
Understanding Your Briefing
All four view modes and every briefing section explained
Hazardous Weather
How PlaneWX interprets turbulence, icing, and convective data
Turbulence Analysis
GTG, PIREPs, and how turbulence severity is assessed
Icing Analysis
CIP/FIP icing products and how they're used in your score