Altitude Advisor
PlaneWX's Altitude Advisor combines winds aloft forecasts, cloud layer analysis, multi-model icing soundings, and turbulence profiles to recommend the optimal cruise altitude for your specific route, aircraft, and flight rules. It goes far beyond a simple winds aloft chart.
What the Altitude Advisor Does
Traditional flight planning means manually checking winds aloft charts, cross-referencing cloud ceilings and tops from METARs and TAFs, and hoping for recent PIREPs. The Altitude Advisor synthesizes all of this — plus model-derived icing and turbulence data — into a single interactive table that shows you exactly what to expect at every altitude along your route.
In short: For every valid altitude (VFR or IFR), the Altitude Advisor calculates ground speed, shows cloud conditions, evaluates icing probability and severity, assesses turbulence from wind shear analysis, and marks the optimal altitude with the best ground speed. One glance gives you the full picture.
Data Sources
The Altitude Advisor fuses data from six independent sources to build a complete vertical profile of your route:
Winds Aloft (FB Forecasts)
NWS winds aloft forecasts from 80+ FB stations nationwide. Direction, speed, and temperature at standard altitudes from 3,000' to FL530. PlaneWX samples multiple stations along your route and calculates distance-weighted average winds.
Cloud Layers (METARs, TAFs, PIREPs)
Real-time cloud coverage from departure and arrival METARs, TAF forecasts for cloud trends, and PIREP-reported cloud tops. These determine ceiling, tops, flight category, and VFR-on-top availability.
Model Icing Soundings (HRRR, GFS, ECMWF)
Three independent weather models provide temperature, humidity, and dewpoint at eight pressure levels. PlaneWX derives icing probability, severity (none/trace/light/moderate/severe), SLD risk, warm nose detection, and freezing level — all interpolated to each altitude.
Model Turbulence (Wind Shear & Ri)
Vertical wind shear and Richardson number (Ri) are derived from the same three models. Turbulence severity (smooth/light/moderate/severe) is shown at each altitude with multi-model consensus confidence.
Route Geometry
True course, distance (Haversine formula), and hemispheric rule for directional altitude filtering. Supports multi-waypoint routes — weather is sampled along the actual flight path, not just departure and arrival.
Aircraft Performance
Your aircraft's TAS and service ceiling determine which altitudes are relevant. For jets and turboprops, TAS is scaled at lower altitudes to reflect real-world IAS/CAS limitations. Pistons maintain nearly constant TAS.
Route Wind Sampling
Unlike a simple "nearest station" lookup, the Altitude Advisor samples winds at multiple points along your route and computes a distance-weighted average. This matters for longer flights where wind conditions vary significantly along the way.
How Route Sampling Works
- Sample points are placed every ~200 NM along your route, with a minimum of 3 and maximum of 10 points. Waypoints are respected — samples follow your actual flight path, not a straight line.
- For each sample point, the nearest FB winds station is found from the 80+ stations in the NWS database. Wind direction, speed, and temperature data at all available altitudes are collected.
- Distance-weighted averaging combines the winds. Each sample point is weighted by the distance it represents (how much of the route it covers). Wind directions are averaged using vector components to correctly handle the 360°/0° wraparound.
- Interpolation fills gaps. If a specific altitude doesn't have exact data, winds are linearly interpolated from the two nearest altitude levels.
Example: A 600 NM flight from KJFK to KORD might sample 4 points using stations ACY, AVP, CLE, and ORD. The winds displayed are a weighted blend of all four, not just the midpoint. The "Winds from X FB stations" banner shows exactly which stations contributed.
Time-Based Forecast Selection
Winds aloft forecasts come in three periods: 6-hour, 12-hour, and 24-hour. The Altitude Advisor automatically selects the best forecast based on when your flight departs:
| Hours Until Departure | Forecast Used | Notes |
|---|---|---|
| 0 – 6 hours | 6-hour forecast | Most accurate — closest to departure |
| 6 – 12 hours | 12-hour forecast | Good accuracy |
| 12 – 24 hours | 24-hour forecast | Lower accuracy but still useful |
| > 72 hours | Not available | Winds aloft not forecast this far out |
If your departure is more than 72 hours away, the Altitude Advisor shows a "Forecasts Not Yet Available" message and suggests checking back closer to departure.
Altitude Selection Rules
The Altitude Advisor follows standard FAA hemispheric rules and adjusts the altitude range based on your aircraft and flight rules:
VFRVFR Altitudes
- • Eastbound (TC 0°–179°): Odd thousands + 500 (3,500, 5,500, 7,500...)
- • Westbound (TC 180°–359°): Even thousands + 500 (4,500, 6,500, 8,500...)
- • IMC altitudes are flagged and faded (not recommended for VFR)
IFRIFR Altitudes
- • Eastbound: Odd thousands (3,000, 5,000, 7,000... up to FL510)
- • Westbound: Even thousands (4,000, 6,000, 8,000... up to FL510)
- • FL290–FL410 (RVSM): 1,000 ft separation available
- • Above FL410: 2,000 ft separation
Aircraft-Aware Altitude Range
The Altitude Advisor uses your aircraft's service ceiling to set the upper limit. For jets and turboprops with a service ceiling at FL350 or above, the lower limit is automatically raised to FL180 — you won't see irrelevant low-altitude rows when flying a Citation or Vision Jet. For pistons and lower-ceiling turboprops, all altitudes from 3,000' up are shown.
Ground Speed Optimization
The core function of the Altitude Advisor is finding the altitude that gets you there fastest. For each altitude, it calculates:
Spherical bearing from departure to destination, accounting for Earth's curvature.
Component of wind along your course. Positive = tailwind (faster), negative = headwind (slower). Calculated from the angle between wind direction and true course.
Component of wind perpendicular to your course. Shown in the detail panel when you click a row.
TAS adjusted for head/tailwind component. The altitude with the highest ground speed is marked optimal.
Estimated time enroute at the selected altitude, based on distance and ground speed.
The icon marks the optimal altitude — the one with the highest ground speed among eligible altitudes. For VFR flights, IMC altitudes are excluded from the optimization (you can see them, but they're not candidates for optimal).
TAS Scaling for Jets & Turboprops
For jets and turboprops, TAS at lower altitudes is significantly slower than at cruise altitude due to IAS/CAS limitations. The Altitude Advisor accounts for this by scaling your TAS based on aircraft type:
| Aircraft Type | Service Ceiling | Low-Alt TAS Factor | Example |
|---|---|---|---|
| Medium+ Jets | FL400+ | 0.55 | TAS 450 at FL450 → ~248 at sea level |
| Light Jets / VLJs | FL300–FL400 | 0.58 | TAS 350 at FL350 → ~203 at sea level |
| Turboprops | FL200–FL300 | 0.72 | TAS 260 at FL250 → ~187 at sea level |
| Pistons | < FL200 | 0.92 | No scaling applied (TAS nearly constant) |
When TAS has been scaled, a "TAS adjusted by altitude" note appears at the bottom of the Altitude Advisor, and the detail panel shows the effective TAS at each altitude.
Cloud Layer Analysis
The Altitude Advisor builds a comprehensive cloud profile from three observational sources plus model-derived humidity data, then checks each altitude against it:
Observational Sources
METARs — Current cloud layers from airport observations (FEW, SCT, BKN, OVC). AGL bases are converted to MSL. High confidence.
TAFs — Forecast cloud layers for the next 24+ hours. Selected for the forecast period closest to your departure. Medium confidence.
PIREPs — Pilot reports with actual cloud bases and tops. These are the only source of observed cloud tops. High confidence.
Model Cross-Reference
METARs and TAFs only observe clouds from the ground — cloud tops are often unknown without PIREPs. The Altitude Advisor cross-references model sounding data to fill this gap. If a model shows relative humidity ≥ 80% or icing probability > 0 at an altitude, that altitude is classified as "in cloud" even if METARs don't report it. This prevents the Advisor from incorrectly showing "Above Tops" when models show continuous moisture.
Sky Column Badges
Clear skies
Some cloud layers
In clouds (BKN/OVC)
Above cloud tops
Visual Markers
Between the altitude rows, the Altitude Advisor displays horizontal marker lines for key atmospheric boundaries. These help you instantly see where the critical transitions are:
Freezing Level
The altitude where temperature crosses 0°C. Shown with per-model breakdown (e.g., "HRRR: 8,200' / GFS: 8,400' / ECMWF: 8,100'") and trend arrows (rising, falling, or steady).
Cloud Base
The lowest altitude where model data indicates cloud (RH ≥ 80%) or icing conditions. Derived from the model soundings for accuracy beyond METAR observations.
Cloud Tops
The highest altitude still showing cloud conditions. Above this line, you're in the clear. Critical for VFR-on-top decisions.
Icing at Each Altitude
When icing conditions exist along your route, an "Icing" column appears in the table. Each altitude shows the worst-case icing from all sample points along the route — not just departure conditions. This is important because icing can intensify or appear mid-route.
What's Shown
No icing expected
Barely perceptible
Manageable with de-ice
Hazardous — consider avoidance
Dangerous — immediate action
SLD & Warm Nose Alerts
When the models detect a temperature inversion creating supercooled large droplet (SLD) risk, prominent red banners appear at the top of the Altitude Advisor showing the affected altitude band. A warm nose alert (amber) appears when an above-freezing layer is embedded in otherwise sub-freezing air — watch for freezing rain below the warm nose.
Click any row to expand the detail panel and see icing probability (percentage bar), severity, confidence level, which models were used, and whether PIREPs or AIRMETs confirm the icing.
Turbulence at Each Altitude
When any altitude along your route shows turbulence, a "Turb" column appears. Turbulence severity is derived from vertical wind shear and Richardson number (Ri) analysis across HRRR, GFS, and ECMWF model soundings.
No turbulence
≥ 12 kt/1000ft shear
≥ 20 kt/1000ft shear
≥ 30 kt/1000ft shear
Clicking a row reveals wind shear in kt/1000ft, Richardson number with stability classification (turbulent, unstable, or stable), and multi-model confidence. For a deep dive into the methodology, see the Turbulence Analysis help page.
Multi-Model Confidence
Both icing and turbulence display a confidence banner showing which models contributed and whether they agree. Hover over the banner for a detailed breakdown:
Very High / High Confidence — All models agree on severity. Example: "All 3 models agree on light."
Moderate Confidence — Most models agree but one differs. Example: "2 of 3 agree (GFS sees trace)."
Low Confidence — Models disagree significantly. Example: "1 of 3 agree — HRRR: none, ECMWF: moderate."
Per-model severity badges appear next to each model name, so you can see at a glance which model is the outlier. PIREP confirmation and active AIRMET badges appear when available.
Temperature & ISA Deviation
The "Temp" column shows forecast temperature at each altitude in °C. Sub-freezing temperatures are highlighted in cyan; above-freezing in orange. When you expand a row, the detail panel also shows the ISA deviation — how far the actual temperature is from International Standard Atmosphere:
ISA formula: Standard temperature = 15°C − (altitude in thousands × 2°C/1000ft). At 10,000', ISA is −5°C. If the actual temp is −8°C, the deviation is ISA −3°C (colder than standard), which typically means denser air and better engine performance but may indicate weather.
Reading the Altitude Table
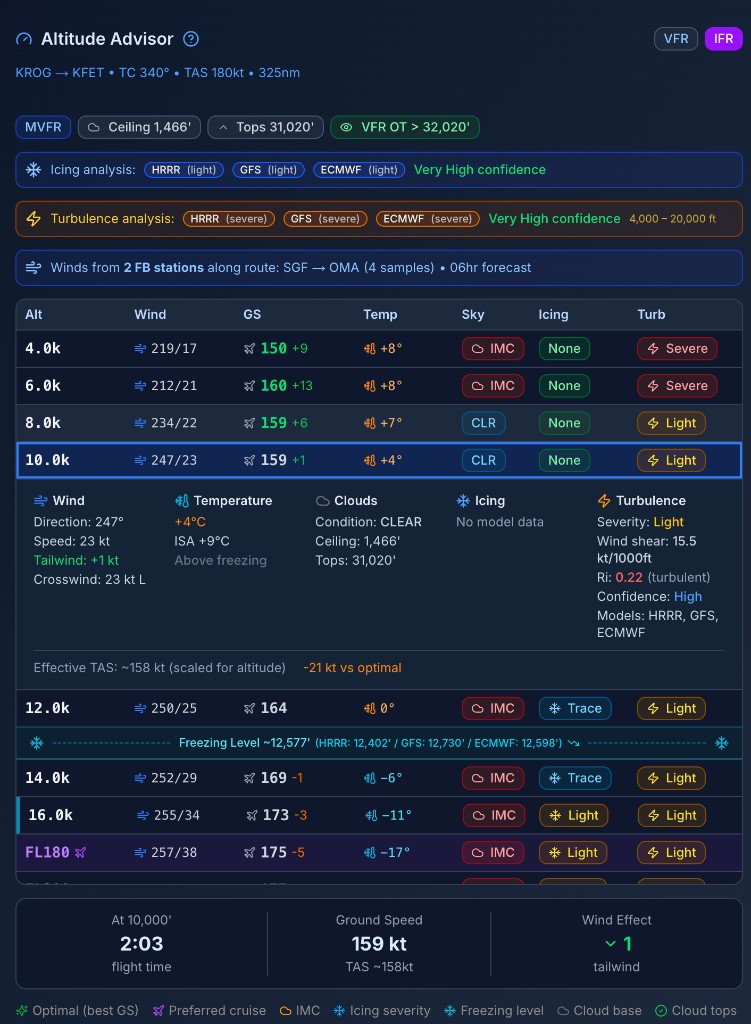
The Altitude Advisor for a KROG → KFET route at 10,000'. Each row shows wind, ground speed, temperature, sky conditions, icing severity, and turbulence severity. The highlighted row is the currently selected altitude. Clicking any row reveals detailed weather data for that level.
Here's a column-by-column guide to the table:
| Column | What It Shows | Color Coding |
|---|---|---|
| Alt | Altitude in thousands or Flight Level | Green = optimal, Purple = your preferred cruise |
| Wind | Direction/speed (e.g., 270/25) | — |
| GS | Ground speed + wind component (e.g., 165 +15) | Green = tailwind, Orange = headwind |
| Temp | Temperature in °C | Cyan = below freezing, Orange = above freezing |
| Sky | Cloud condition at this altitude | Red (IMC), Green (Above), Blue (CLR) |
| Icing | Worst-case icing severity along the route | Green → Yellow → Orange → Red by severity |
| Turb | Worst-case turbulence severity | Green (Smooth) → Yellow → Orange → Red |
The Icing and Turb columns only appear when at least one altitude has a non-none value — on a clear, smooth day, you'll see just the five core columns.
Expanded Detail Panel
Click any altitude row to expand a detail panel showing everything at that altitude:
Wind
Direction, speed, headwind/tailwind component, crosswind component.
Temperature
Actual temperature, ISA deviation, above/below freezing status.
Clouds
Cloud condition (IMC, Above Tops, or coverage), ceiling, and tops.
Icing
Probability bar, severity, confidence, models used, SLD risk, PIREP confirmation, AIRMET status.
Turbulence
Severity, wind shear (kt/1000ft), Richardson number with stability label, confidence, models used.
Performance
Effective TAS (if scaled), ground speed difference vs. optimal altitude.
Summary Bar
Below the altitude table, three key metrics are shown for the currently selected altitude:
Flight Time
1:42
at selected altitude
Ground Speed
165 kt
TAS + wind
Wind Effect
+15
tailwind
VFR On Top Analysis
When cloud tops are identified (from PIREPs or model data), the Altitude Advisor displays a green "VFR OT > X'" badge in the header showing the lowest altitude for VFR On Top. The calculation requires 1,000 feet of clearance above the highest BKN/OVC layer.
Note for VFR pilots: When flying VFR, altitudes that would put you in clouds (IMC) are faded and excluded from the optimal altitude calculation. You can still see them and click for details, but they won't be recommended. Toggle to IFR mode if you want to see all altitudes as candidates.
Multi-Waypoint Route Support
The Altitude Advisor supports routes with intermediate waypoints. When waypoints are provided:
- Wind samples follow the actual route path, not a straight line from origin to destination
- Model soundings are fetched at points along the polyline route
- Icing and turbulence are evaluated at each segment of the route
- METARs, TAFs, and PIREPs are collected from waypoint airports in addition to departure and arrival
Limitations
Forecast, not observation. All data is forecast-based (except METARs and PIREPs). Actual conditions may differ. Always cross-check with real-time observations.
Cloud tops are often unknown. Without recent PIREPs, cloud tops come from model humidity data (RH ≥ 80%), which is an estimate. The model cross-reference helps but isn't perfect.
Winds aloft are from FB bulletins. These are issued every 6 hours and represent a snapshot. Conditions between issuances may change, especially near frontal boundaries.
TAS scaling is approximate. The altitude-based TAS adjustment uses general performance curves for aircraft categories, not your specific POH data. Treat ground speed estimates at non-cruise altitudes as approximations.
Turbulence is CAT only. Model-derived turbulence detects clear-air turbulence from wind shear. Convective, mountain wave, and mechanical turbulence are not captured in this analysis.
Not a replacement for official briefing. The Altitude Advisor is a supplemental planning tool. Always obtain a standard weather briefing from official sources before flight.
Related Topics
Deep dive into icing detection, severity, SLD risk, and model consensus.
Wind shear thresholds, Richardson number, and clear-air turbulence methodology.
How icing, turbulence, and winds factor into your overall Go/No-Go score.
How PlaneWX detects and flags dangerous weather conditions.
The Altitude Advisor combines NWS winds aloft forecasts, METAR/TAF/PIREP cloud observations, HRRR, GFS, and ECMWF model soundings for icing and turbulence, and your aircraft performance data to provide the most complete altitude analysis available in a general aviation weather app. Always verify with official sources before flight.